VIMS engineer

Resonance of machines and structures

Resonance of machines and structures – That is, how to perform the BUMP TEST without turning off the machine, with the support of negative averaging….

Taking hundreds of measurements, in various industrial plants, it is not uncommon to encounter high levels of vibration, associated with the phenomenon of resonance. This seemingly well-known phenomenon has repeatedly caused quite a problem, especially in new installations just put into operation.

Figure 1: Exceeded alarm levels in the new seal oil pump installation.

The economic realities of fleet expansion or modernization often lead to the task being carried out by multiple entities, each of which is responsible for part of the installation. One supplier provides the machine, another the foundation, someone else the piping for the pump, or the ductwork for the fan. Everything is theoretically overseen by the General Contractor, but in his investment task he rarely considers the interaction of equipment and installations. It gets to the point of acceptance of new installations and a problem arises. Vibration levels deviate considerably from those assumed, for example, according to ISO 10816 (20816). Conflict develops over responsibility for such a state of affairs:

The machine supplier says: I have the protocol from the test station and my machine is within the established thresholds, I can reassemble it on the test bench and prove it.

The foundation contractor says: I made the frame according to the design. The welds are inspected, the profile cross sections are adequate, the visual inspection does not give rise to a claim.

The piping installer says: Pipes made according to the project, cross sections are in accordance, tightness is maintained, there are no grounds for a claim.

The general contractor combines: The machine is new, the foundation is whole, the pipeline is tight, the vibration probably comes from another source.

The customer is left with quite a problem. The contractor’s arguments are unassailable, and he can’t run the plant because working at elevated levels will void the warranty and damage the machine. And he counts the losses…

Resonant operation often turns out to be the culprit, because no one has taken into account the masses, stiffness and natural frequencies of the entire, interconnected system of machinery and installations. What does this mean? Every structure is characterized by a certain or certain resonant frequencies. Stimulation of such a structure will cause a response in the form of “amplification” of certain frequencies and rapid extinction of others. Just like a guitar string plucked with your fingers, it will always produce a sound at a given frequency. This means nothing more than that it will vibrate with its natural frequency. The same is true of any structure. When we stimulate it, for example by hitting it with a hammer, and measure the frequency response, we can record which frequencies are quickly extinguished and which tend to last longer. This is nothing more than a BUMP TEST, which can be detected with a good vibration analyzer like the ADASH A5400 VA-5 Pro or the Iris M™/MX™ kit and Motion Amplification® technology.

Adash A4500 VA5 4-KANAL MULTIFUNKTIONS ANALYSATOR

Figure 2: ADASH A5400 VA-5 Pro advanced vibration analyzer, with BUMP TEST module and negative averaging.

Figure 3: IRIS M vibration visualization and measurement kit with Motion Amplification® technology.

Professional vibration analyzers have such capabilities, thanks to special software modules, they allow to perform shock test and natural frequency detection quite efficiently and quickly.

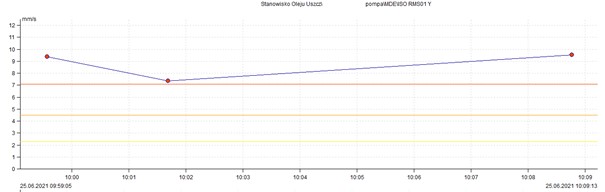
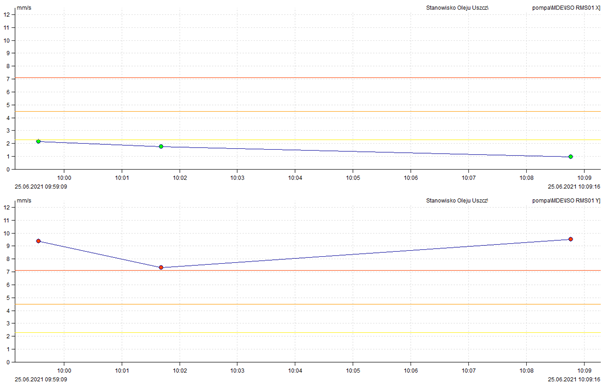
Resonances are characterized by directionality – usually the stiffness of the structure in a given direction is higher or lower than in perpendicular directions. This is another of the properties that confirms the presence of resonances. By measuring vibrations in multiple directions and observing significant differences in amplitudes, resonance can be suspected. The trend plot of the rms value of the vibration velocity in mutually perpendicular X – Y directions, posted below, illustrates such a case.

Figure 4: Pump vibration measurements X Y directions. Alarm vibration level in Y direction, with low values in X direction.

BUMP-TEST

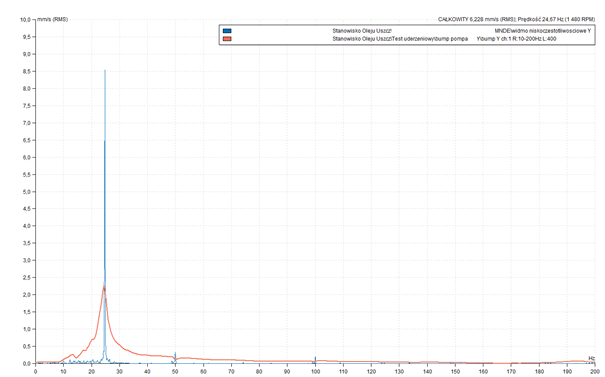
The shock test is performed by applying an accelerometer to a machine or structure and stimulating it with, for example, a hammer blow while the machine is stopped. The goal is to diagnose natural frequencies, not those from the operation of the machine, related to: rotor imbalance, misalignment, backlash, or other malfunctions. But what if the machine can’t be stopped, and a bump test is needed? The NEGATIVE ASSEMBLY function comes to the rescue.

Figure 5: Impact test (BUMP TEST) with negative averaging (NEGATIVE AVERAGING).

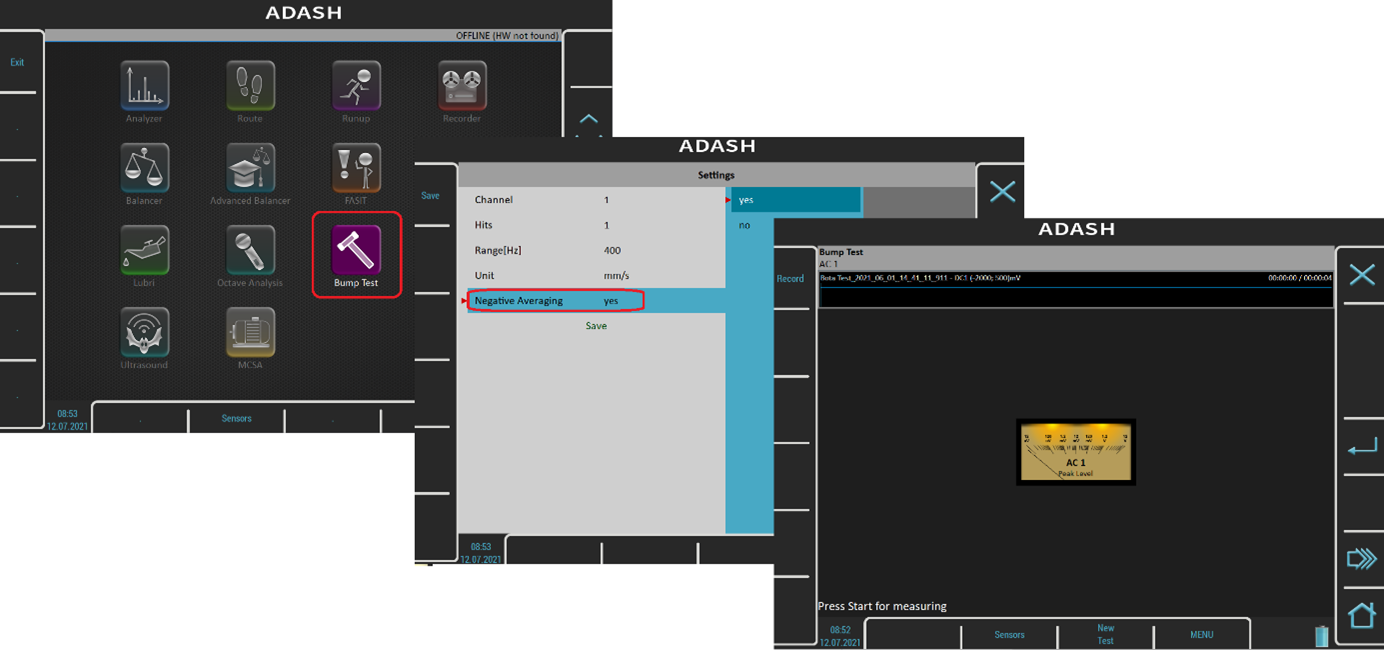
This involves taking a pre-measurement of the running machine and “teaching” the analyzer the behavior of the system, during operation. The vibration frequency spectrum, thus recorded, is then taken as a reference level, and now a bump test can be performed, while the machine is running, exactly as if it were stopped. Thanks to negative averaging, we make a proper detection of natural frequencies.

When we measure the vibration spectrum of the machine’s operation and compare it with the spectrum from the bump test, we quickly determine whether the frequencies from the operation are too close to the natural frequencies. It is assumed that the safe margin is +/- 20% between the natural frequency and that from the machine operation.

Figure 6: Superimposed spectrum of pump operation (blue) and bump test result (red) in X direction.

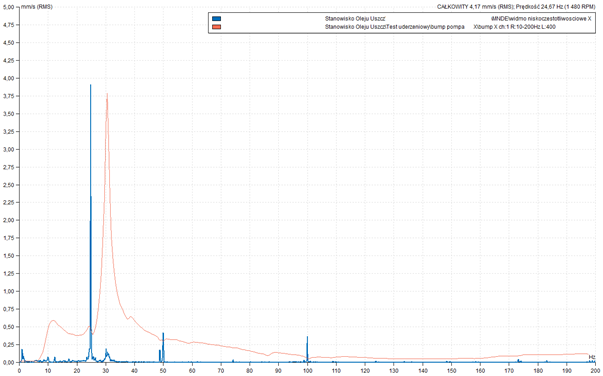
The figure illustrates an acceptable case, where the natural frequency detected by the BUMP TEST shock test of about 30 Hz is 5 Hz away from the operating frequency of the machine, about 25 Hz, which is more than 20% of the margin.

Figure 7: Superimposed spectrum of pump operation (blue) and the result of the bump test (red) in the Y-direction – operation in resonance.

The figure illustrates the almost perfect overlap of the resonant frequency (red graph), with the pump operating frequency (blue graph). Lacking the required 20% margin and operating at resonance. Corrective action is needed, since prolonged operation at resonance will lead to fatigue cracks and failure of the rotating machinery, piping system and perhaps even the structure.

So we have determined that the pump is operating in resonance, in the Y direction, and now what?

Change the speed of the machine (if possible) or change the natural frequency of the system. There are 2 ways to do this:

Changing the mass, whereby increasing the mass lowers the natural frequency. Just like in a guitar, a thicker string will play a lower sound.
Changing the stiffness, whereby stiffening the system through additional anchoring, sections, etc., welds, raises the natural frequency. According to the rule of thumb, a tighter string, plays a higher sound.
And here comes the temptation to “properly” stiffen the layout. Just be sure not to cause a shift of the natural frequency, towards other frequencies appearing in the installation, for example, from another machine, mounted on a common frame.

Summary

Before performing an upgrade, it is worthwhile to consult the changes with the system designer, and after the upgrade it is always worthwhile to perform control measurements and make sure that the measures were performed according to plan and had the expected effect. This can be done with a classic vibration analyzer or visualized with the Iris M kit.

There are other methods of detecting resonances using vibration measurements, and we invite you to follow our series of publications where they will be described in more detail.

If you suspect a resonance problem and can’t diagnose it, VIMS engineers will be happy to help by taking advanced measurements, either with a vibration analyzer or by visualizing the problem using Motion Amplification® technology.

Feel free to contact us: info@vims.de

Cookie Consent with Real Cookie Banner