Acquiring vibration data is only part of the vibration measurement challenge; the other part is analyzing the resulting data. It is important to understand the types of time courses involved in vibration analysis, the important differences between them, and when it is appropriate to use each type of vibration analysis tool. Here is a brief overview of some of the basics.
Time domain vibration analysis
Vibration analysis begins with a time-varying real signal from a transducer or sensor. Interpretation of vibration data in the time domain (amplitude plotted as a function of time) is limited to a few parameters in determining vibration levels: amplitude, peak value and rms value, which are identified in a sinusoidal waveform.
The peak value or amplitude is relevant for impulsive events, but does not take into account the duration and thus the energy in the event.
The same applies to the peak value with the added benefit of providing the maximum swing of the waveform. This is useful when reviewing displacement information, particularly backlash.
The RMS value is generally the most useful, as it is directly related to the energy level of the vibration and thus the destructive magnitude of the vibration.
Vibration is an oscillatory motion, so most vibration analyses aim to determine the rate of this oscillation or frequency. The number of occurrences of a complete cycle of motion in a period of one second is the frequency of vibration and is measured in Hz. For simple sine waves, the oscillation frequency can be determined by observing the waveform in the time domain; however, when various frequency components and noise are added, spectrum analysis is necessary to get a clearer picture of the oscillation frequency.
Analysis of vibrations in the frequency domain
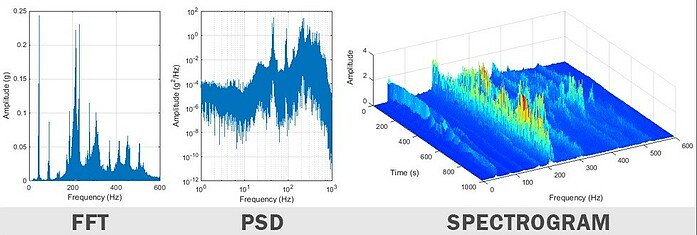
Fast Fourier transform (FFT)
The fast Fourier transform (FFT) is an efficient algorithm used to calculate the discrete Fourier transform (DFT). This Fourier transform derives the amplitude of a vibration as a function of frequency, so the analyzer can indicate, the causes of the vibration. The frequency resolution of the FFT is directly proportional to the signal length and sampling frequency. To improve the resolution, the recording time must be increased, but care must be taken with the changing vibration environment.
Spectrogram
The spectrogram takes a series of FFT spectra to illustrate how the spectrum (frequency domain) changes over time. If the vibration analysis is performed in a changing environment, the spectrogram will be a powerful tool for illustrating exactly how that vibration spectrum changes.
Power spectral density
The power spectral density (PSD) takes the amplitude of the FFT, multiplies it by the complex conjugation and normalizes it to the width of the frequency interval. This allows accurate comparison of random vibration signals that have different signal lengths. For this reason, PSD is typically used to describe a random vibration environment, such as those specified in military and commercial test standards.